Creating Grids with QGIS
- Vernika Monk
- Jul 3, 2025
- 8 min read
Updated: Aug 1, 2025
Gridlines form into horizontal and vertical lines, which provide a visual presentation of a geographic coordinate system (GCS). The points were the lines intercept are each geographic coordinate pair or graticules, which can represent the same true location on the earth surface. The precision of the coordinate values depends on where and how the points are measured (i.e. datum, surface of the earth, geoid, etc.).
However, as you transform from an unprojected three-dimensional (x, y, z) earth surface to a two-dimensional projected surface your map becomes distorted. As a result, the positions of your gridlines will change. Therefore, since, the goal is to have your map resemble the earth as much as
possible, then choosing the best projection is an aspect to consider when creating your grid.
Hence, after considering the geographic and projected coordinate systems, then you can create the gridlines to pinpoint exact locations, discover distances between points, or identify features for various purposes (i.e. navigational, thematic).
Click each toggle below to discover how to create gridlines for your map with QGis. Link to view grid hints and completed grid maps grid map1, grid map2.
(1) PROJECT YOUR MAP
The accurate locations and features on your map depend on the projection that you choose. It is important to choose the best projection because the transformation from the earth's surface to a two-dimensional surface will cause certain distortions, such as landmass changes, and inaccurate measurements. This, in turn, will effect the positions of the gridlines and how they are represented from the earth surface onto your map. Hence, as you choose the best projection, you should consider the location on the earth, its' orientation to the earth, its latitude range, class (cylinder, conic, planer), and the characteristics (distance, shape, area, direction) you wish to keep for the purpose of your map. Consider the following projection:
![This is the Albers Equal-Area Projection, which is based on the conic projected class (i.e. northern hemisphere). The latitude and longitude gridlines causes an exaggerated appearance away from the standard parallels (10N° and 70°N). This will result in incorrect distance and direction beyond the standard lines. This projection keeps equivalent regions within the lines, but causes conformality to diminish. It is best suited for thematic maps, which will keep equivalency of landmasses in the east-west direction. Source map: By Tobias Jung [CC BY-SA 4.0] via mapprojections.](https://static.wixstatic.com/media/1d7041_33d2facd074947d0abb0aec88ca77fb7~mv2.png/v1/fill/w_49,h_26,al_c,q_85,usm_0.66_1.00_0.01,blur_2,enc_avif,quality_auto/1d7041_33d2facd074947d0abb0aec88ca77fb7~mv2.png)
Note: There are online tools that can assist you in determining the best projection, such as the Projection Wizard, Compare Map Projections or epsg.io.
To change the projection:
Right click your feature
Export- Save as feature as..
'Save Vector Layer as...' box appears
File Name: create a new name for the projected file (i.e. projected_Map)
Click BROWSE button
Navigate to the directory to put your file
Click SAVE
CRS: select the GLOBE button
'Coordinate Reference System Selector' box appears
Select the coordinate system according to the need of your map.
Click OK button
Click OK button
(2) CREATE LAYOUT
Select: Project- Layout Manager
'Layout Manager' box appears
Select 'New from Template' toggle: Click CREATE button
'Create Print Layout' box appears
Type: Layout title (i.e. Venzuela)
Click OK button
Layout interface canvas appears with header (i.e. 'Venzuela')
Click CLOSE button in 'Layout Manager' box
Select: Add Items- Add Map
Drag a rectangle onto layout to place on the map
Ensure the map is selected in the interface canvas
(3) CREATE YOUR GRID
***Note: Keep in mind the extent, units and projection the CRS as you create your gridlines
** Ensure the map is selected in the view interface
Select or Open 'Item Properties' tab
To select: Click the 'Item Properties' tab
To open: View- Panels- Check the 'Item Properties' box ('Item Properties' interface appears)
Select 'Map Properties' toggle
Choose a scale for your map (Note: the number of gridlines are effected by the scale)
CRS: Select the GLOBE button or 'Use Project CRS'
'Map Items CRS' interface appears
Select from dropdown menu 'Predefined CRS'
Select a CRS (Note: Your map features will display according to the 'project' CRS selected)
Select 'Layers' toggle (this ensures the map stays in the same place)
Check Lock layers
Check Lock styles for layers
Select 'Extents' toggle
Enter the extent of your map
Select 'Grids' toggle
Click the PLUS SIGN button
Grid name will appear in the box (by default it is called 'Grid 1')
Click MODIFY GRID... button
'Map Grid Properties' interface appears

Note: If you want a different name for your grid, then double-click the 'Grid 1' name to change it.
(3.1) Select 'Appearance' toggle
Grid Type: Solid
CRS: select the GLOBE button or 'Use Map CRS'
Select from dropdown menu 'Predefined CRS'
Select a CRS (Note: Your graticules will display according to the 'map units' CRS selected)
Intervals: Choose one of the following
Select 'Fit Segment width' (This selection creates the grid lines automatically. It adjusts the spacing between the gridlines based on the map extent by calculating and selecting the best intervals to display. This ensures the correct spacing between the grid lines whenever the map scale is adjusted or changes.)
Navigate to the top of the 'Map grid Properties' interface, then click the 'Enable grid' off, then back on to display the gridlines.
Minimum & Maximum Values: (By default these ranges are provided. They are the range of distances that is searched to discover the best grid intervals. These values can be adjusted to suit your map needs.
Select 'Map Units' (You determine the distance between the gridlines. The interval gridlines (i.e decimal, measured degrees, etc.) will display based on the CRS you selected).
X: The number of intervals between coordinates in the x direction
Y: The number of intervals between coordinates in the y direction

Depicted is the x-interval change as 2.0 or every 2 degrees, and the y-interval change as 2.0 or every 2 degrees. Note: Navigate to the bottom of the page for examples of how to convert map unit intervals.
(3.2) Select 'Frame' toggle
Frame style: Choose a style (i.e. Interior and Exterior Ticks)
The frame style you select will appear
You can keep all the defaults or change the Frame (margin, thickness, etc.)
(3.3) Scroll to 'Draw Coordinates' toggle
Check box 'Draw Coordinates'
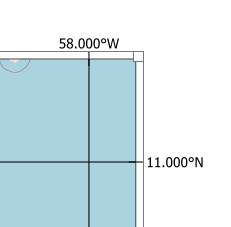
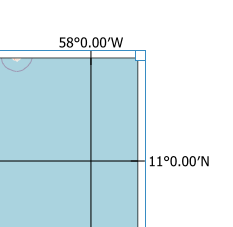
Format: Select the format for your coordinate labels (i.e. degrees, minutes with suffix, etc.)
The format label you select will appear.

Left, Right, Top & Bottom: Choose the location of the annotation or coordinates to display (inside the grid, outside the grid, latitude only, etc.)
Font: Change the font style
Distance to map frame: The coordinate annotation's distance from the grid border.
Choose precision: Choose how to display the level of accuracy of each coordinate annotation based on the map units.
(3.4) Select 'Appearance' toggle - Offset
Offset: (select the position of the gridlines)
Positive numbers will shift grid to the right (X) and up (Y)
Negative number will shift grid to the left(X) and down (y)
You can visually adjust the gridlines or adjust by a certain amount such as shift up 0.60 or 36°.
Example of creating offset of the map gridlines:


ADDITIONAL GRID HINTS:
Display Issues:
(1) Grid does not display
Anytime you make changes to the grid, or need to display labels, or the gridlines do not appear, then
Navigate to the top of the 'Map grid Properties' interface
Click the 'Enable grid' off, then back on (or vis versa).
(2) Frame box does not display
Whenever you create a border or frame for your grid with the 'interior ticks', 'exterior ticks' or 'interior and exterior ticks' the grid border will not appear, thus
Navigate to main 'Item Properties' interface
Scroll to 'Frame' toggle
Check box to create a border.
Customize Coordinates with code:
(1) Create UTM coordinate labels
Navigate to 'Draw Coordinates' toggle
Format: select 'Custom'
Click EXPRESSION BASED ANNOTATION button (i.e. 'e' symbol)
Select the 'Function' tab
Click Plus sign button (at bottom of page)
'Add Function File' box appears
Create a function name (i.e. UTM_value)
Click OK button
Highlight the function name created
In the interface type the following code:
from qgis.core import *
from qgis.gui import *
@qgsfunction(args='auto', group='Custom')
def UTM_Value(gridNumber, feature, parent):
gridString = str(int(gridNumber)) ##change the gridNumber (UTM label) into a string array
fullString = ' ' ##array to put the final label
supScr = (u'\u2070', u'\u00B9', u'\u00B2',u'\u00B3',u'\u2074',u'\u2075',u'\u2076',u'\u2077',u'\u2078',u'\u2079') ##superscript annotations will replace the gridnumber.
charNum = len(gridString) ##the length of the stringed number is assigned to 'charNum'
for char in gridString: ##each character in the gridSting arrray is evaluated within the if condition
if charNum == 5: ##checks to see if it is the 5th character (number)
fullString += char ##if it is the 5th charater it will be placed as the original number
else:
fullString += supScr[int(char)] ##all characters that are not the 5th character are changed into a superscript
charNum -=1 ##goes to the next character until all number in the array have been evaluated
return fullString ##returns the values in the empty array as the final gridnumber (UTM label)
Select the 'Expression' tab

The new function (i.e. UTM_Value) will appear under 'Custom' within the 'Expression' tab. Type the following code in the Expression interface:
UTM_Value ( @grid_number )

This UTM grid values were created with the CRS: NAD83(2011) / UTM zone 12N for the state of Wyoming. They are created at a 10,000 meter measure of accuracy. The geographic coordinates were added as a second grid. Type the following code to append a suffix to the UTM label:
CASE
WHEN @grid_axis = 'x' THEN
UTM_Value( @grid_number ) || ' mW' ##function returns the final grid label for the UTM easting
WHEN @grid_axis = 'y' THEN
UTM_Value( @grid_number ) || ' mN' ##function returns the final grid label for the UTM northing
END
Click OK button
(2) Change grid numbers to decimal degrees, degrees & minutes, etc.
Navigate to 'Draw Coordinates' toggle
Format: select 'Custom'
Click EXPRESSION BASED ANNOTATION button (i.e. 'e' symbol)
Type the following code:
CASE
WHEN @grid_axis='x' THEN ##grid_axis identifies the direction of the x-axis (longitude)
to_dms(@grid_number, 'x', 2) || 'W' ##to_dms: converts to degree, minute, seconds ##grid_number identifies the coordinate to label
##the precision of the coordinate value.
##the '||' symbol appends a label 'W' (West)
WHEN @grid_axis='y' THEN ##grid_axis identifies the direction of the y-axis (latitude)
to_dms(@grid_number, 'y', 2) || 'N' ##to_dms: converts to degree, minute, seconds
##grid_number identifies the coordinate to label
##the precision of the coordinate value.
##the '||' symbol appends the label 'N' (North)
END


(3) Remove digits from a decimal degree
Type the following code:
left (right (@grid_number, 5),2 ) ##removes the grid number from the right 5 spaces, then keeps 2 from the left.
Example:
30470393 --> 70
Coverting Map Units Intervals:
(1) Converting map units
Helpful guide on how to convert grid numbers to decimal, degrees & minutes, etc.
Navigate to 'Appearance' toggle
Intervals: Select 'Map Units'
To create coordinate intervals for every 3°, then type '3.0'.
To create coordinate intervals for every 2 degrees, 30 minutes, and 35 seconds, then type '2.509722'.


Gridline Creation:

